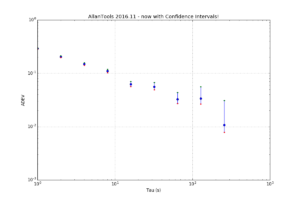
I've added confidence interval estimation to allantools, based on a 2004 paper by Greenhall & Riley: "Uncertainty of stability variances based on finite differences"
So far not much is automated so you have to run everything manually. After a normal call to allantools.adev() to calculate the ADEV we loop through each (tau, adev) pair and first call allantools.edf_greenhall() to get the number of equivalent-degrees-of-freedom (EDF), and then evaluate a confidence interval with allantools.confidence_interval(). A knowledge or estimate of the noise type "alpha" is required for edf_greenhall() - here we just assume alpha=0.
This example is on github at: https://github.com/aewallin/allantools/blob/master/examples/ci_demo.py
import numpy import matplotlib.pyplot as plt import allantools as at # this demonstrates how to calculate confidence intervals for ADEV # using the algorithms from Greenhall2004 data_file = '../tests/phasedat/PHASE.DAT' def read_datafile(filename): p = [] with open(filename) as f: for line in f: if not line.startswith("#"): # skip comments p.append(float(line)) return p # read input data from file phase = read_datafile(data_file) # normal ADEV computation, giving naive 1/sqrt(N) errors (taus,devs,errs,ns) = at.adev(phase, taus='octave') # Confidence-intervals for each (tau,adev) pair separately. cis=[] for (t,dev) in zip(taus,devs): # Greenhalls EDF (Equivalent Degrees of Freedom) # alpha +2,...,-4 noise type, either estimated or known # d 1 first-difference variance, 2 allan variance, 3 hadamard variance # we require: alpha+2*d >1 (is this ever false?) # m tau/tau0 averaging factor # N number of phase observations edf = at.edf_greenhall( alpha=0, d=2, m=t, N=len(phase), overlapping = False, modified=False ) # with the known EDF we get CIs # for 1-sigma confidence we set # ci = scipy.special.erf(1/math.sqrt(2)) = 0.68268949213708585 (lo,hi) = at.confidence_intervals( dev=dev, ci=0.68268949213708585, edf=edf ) cis.append( (lo,hi) ) # now we are ready to print and plot the results print "Tau\tmin Dev\t\tDev\t\tMax Dev" for (tau,dev,ci) in zip(taus,devs,cis): print "%d\t%f\t%f\t%f" % (tau, ci[0], dev, ci[1] ) """ output is Tau min Dev Dev Max Dev 1 0.285114 0.292232 0.299910 2 0.197831 0.205102 0.213237 4 0.141970 0.149427 0.158198 8 0.102541 0.110135 0.119711 16 0.056510 0.062381 0.070569 32 0.049153 0.056233 0.067632 64 0.027109 0.032550 0.043536 128 0.026481 0.033855 0.055737 256 0.007838 0.010799 0.031075 """ plt.figure(figsize=(12,8)) plt.gca().set_yscale('log') plt.gca().set_xscale('log') err_lo = [ d-ci[0] for (d,ci) in zip(devs,cis)] err_hi = [ ci[1]-d for (d,ci) in zip(devs,cis)] plt.errorbar(taus, devs, yerr=[ err_lo, err_hi ] ,fmt='o') plt.grid() plt.xlabel('Tau (s)') plt.ylabel('ADEV') plt.title('AllanTools 2016.11 - now with Confidence Intervals!') # just to check plot the intervals as dots also plt.plot(taus, [ci[0] for ci in cis],'r.') plt.plot(taus, [ci[1] for ci in cis],'g.') plt.show() |

One thought on “AllanTools 2016.11 - now with Confidence Intervals!”