ADF4350 PLL+VCO and AD9912 DDS power spectra

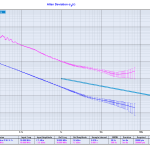
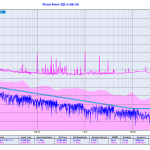
Update 2015-09-28: ADEV and Phase-noise measured with a 3120A:


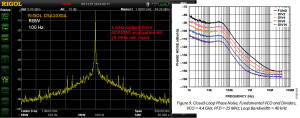
Here's the 1 GHz output of an ADF4350 PLL+VCO evaluation board, when used with a 25 MHz reference.

The datasheet shows a phase noise of around -100 dBc/Hz @ 1-100 kHz, so this measurement may in fact be dominated by the Rigol DSA1030A phase noise which is quoted as -88 dBc/Hz @ 10 kHz.

1GHz_adf4350_output_with_25MHz_ref-input

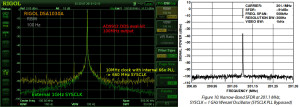
The 1 GHz output from the ADF4350 is used as a SYCLK input for an AD9912 DDS. The spectrum below shows a 100 MHz output signal from the DDS with either a 660 MHz or 1 GHz SYSCLK. The 660 MHz SYSCLK is from a 10 MHz reference multiplied 66x by the AD9912 on-board PLL. The 1 GHz SYSCLK is from the ADF4350, with the AD9912 PLL disabled.

The AD9912 output is clearly improved when using an external 1 GHz SYSCLK. The noise-floor drops from -80 dBm to below -90 dBm @ 250 kHz from the carrier. The spurious peaks at +/- 50 kHz disappear. However this result is still far from the datasheet result where all noise is below -95 dBm just a few kHz from the carrier. It shouldn't matter much that the datasheet shows a 200MHz output while I measured a 100 MHz output.

Again I suspect the Rigol DSA1030A's phase-noise performance of -88dBc/Hz @ 10 kHz may in fact significantly determine the shape of the peak. Maybe the real DDS output is a clean delta-peak, we just see it like this with the spectrum analyzer?

100MHz_AD9912_internal_vs_external_PLL

Martein/PA3AKE has similar but much nicer results over here: 1 GHz refclock and 14 MHz output from AD9910 DDS. Amazingly both these spectra show a noise-floor below -90 dBm @ 50 Hz! Maybe it's because the spectrum analyzer used (Wandel & Goltermann SNA-62) is much better?

DDS Front Panel

Two of these 1U 19" rack-enclosure front panels came in from Shaeffer today. Around 70 euros each, and the best thing is you get an instant quote on the front panel while you are designing it with their Front Panel Designer software. The box will house an AD9912 DDS.

dds_panel_0

From left to right: 10 MHz reference frequency input BNC, DDS output BNC, 40mm fan (1824257 and 1545841), 20x2 character LCD (73-1289-ND), rotary encoder with pushbutton (102-1767-ND), and rightmost an Arduino Due (1050-1049-ND) with Ethernet shield (1050-1039-ND). The panel is made to fit a Schroff 1U enclosure (1816030) with the inside PCBs mounted to a chassis plate (1370461).

dds_panel_1

Here's a view from the inside. I milled down the panel thickness from 4 mm to around 2.5 mm on the inside around the rotary encoder. Otherwise all components seem to fit as designed.

dds_panel_2

Next stop is coding an improved user-interface as well as remote-control of the DDS and PLL over Ethernet.

Drop-Cutter toroid edge test

The basic CAM-algorithm called axial tool projection, or drop-cutter, works by dropping down a cutter along the z-axis, at a chosen (x,y) location, until we make contact with the CAD model. Since the CAD model consists of triangles, drop-cutter reduces to testing cutters against the triangle vertices, edges, and facets. The most advanced of the basic cutter shapes is the BullCutter, a.k.a. Toroidal cutter, a.k.a. Filleted endmill. On the other hand the most involved of the triangle-tests is the edge test. We thus conclude that the most complex code by far in drop-cutter is the torus edge test.

The opencamlib code that implements this is spread among a few files:

  • millingcutter.cpp translates/rotates the geometry into a "canonical" configuration with CL=(0,0), and the P1-P2 edge along the X-axis.
  • bullcutter.cpp creates the correct ellipse, calls the ellipse-solver, returns the result
  • ellipse.cpp ellipse geometry
  • ellipseposition.cpp represents a point along the perimeter of the ellipse
  • brent_zero.hpp has a general purpose root-finding algorithm

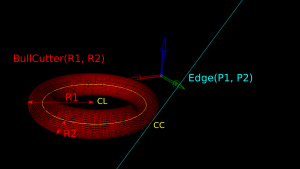
The special cases where we contact the flat bottom of the cutter, or the cylindrical shaft, are easy to deal with. So in the general case where we make contact with the toroid the geometry looks like this:
oe1_text

Here we've fixed the XY coordinates of the cutter location (CL) point, and we're using a filleted endmill of radius R1 with a corner radius of R2. In other words R1-R2 is the major radius and R2 is the minor radius of the Torus. The edge we are testing against is defined by two points P1 and P2 (not shown). The location of these points doesn't really matter, as we do the test against an infinite line through the points (at the end we check if CC is inside the P1-P2 edge). The z-coordinate of CL is the unknown we are after, and we also want the cutter contact point (CC).

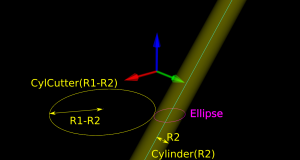
There are many ways to solve this problem, but one is based on the offset ellipse. We first realize that dropping down an R2-minor-radius Torus against a zero-radius thin line is actually equivalent to dropping down a zero-minor-radius Torus (a circle or 'ring' or CylCutter) against a R2-radius edge (the edge expanded to an R2-radius cylinder). If we now move into the 2D XY plane of this circle and slice the R2-radius cylinder we get an ellipse:
oe3text

The circle and ellipse share a common virtual cutter contact point (VCC). At this point the tangents of both curves match, and since the point lies on the R1-R2 circle its distance to CL is exactly R1-R2. In order to find VCC we choose a point along the perimeter of the ellipse (an ellipse-point or ePoint), find out the normal direction, and go a distance R1-R2 along the normal. We arrive at an offset-ellipse point (oePoint), and if we slide the ePoint around the ellipse, the oePoint traces out an offset ellipse.
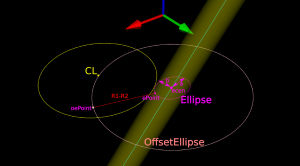
oe4_text

Now for the shocking news: an offset-ellipse doesn't have any mathematically convenient representation that helps us solve this!
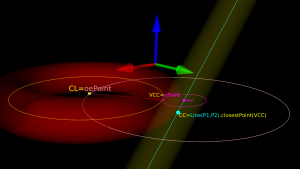
Instead we must numerically find the best ePoint such that the oePoint coincides with CL. Like so:
oe5text

Once we've found the correct ePoint, this locates the ellipse along the edge and the Z-axis - and thus CL and the cutter . If we go back to looking at the Torus it is obvious that the real CC point is now the point on the P1-P2 line that is closest to VCC.

In order to run Brent's root finding algorithm we must first bracket the root. The error we are minimizing is the difference in Y-coordinate between the oePoint and the CL point. It turns out that oePoints calculated for diangles of 0 and 3 bracket the root. Diangle 0 corresponds to the offset normal aligned with the X-axis, and diangle 3 to the offset normal  aligned with the Y-axis:
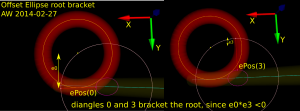
oe_bracket_drawing


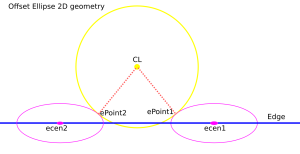
Finally a clarifying drawing in 2D. The ellipse center is constrained to lie on the edge, which is aligned with the X-axis, and thus we know the Y-coordinate of the ellipse center. What we get out of the 2D computation is actually the X-coordinate of the ellipse center. In fact we get two solutions, because there are two ePoints that match our requirement that the oePoint should coincide with CL:
oe_2d_drawing


Once the ellipse center is known in the XY plane, we can project onto the Edge and find the Z-coordinate. In drop-cutter we obviously approach everything from above, so between the two potential solutions we choose the one with a higher z-coordinate.

The two ePoint solutions have a geometric meaning. One corresponds to a contact between the Torus and the Edge on the underside of the Torus, while the other solution corresponds to a contact point on the topside of the Torus:

I wonder how this is done in the recently released pycam++?
OpenCAMlib and OpenVoronoi toolpath examples

There might be renewed hope for a FreeCAD CAM module. Here are some examples of what opencamlib and openvoronoi can do currently.

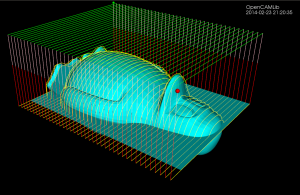
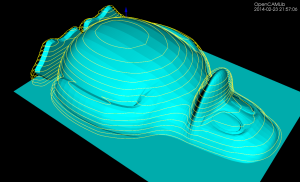
The drop-cutter algorithm is the oldest and most stable. This shows a parallel finish toolpath but many variations are possible.

parallel_finish_zig

The waterline algorithm has some bugs that show up now and then, but mostly it works. This is useful for finish milling of steep areas for the model. A smart algorithm would use paralllel finish on flat areas and waterline finish on steep areas. Another use for the waterline algorithm is "terrace roughing" where the waterline defines a pocket at a certain z-height of the model, and we run a pocketing path to rough mill the stock at this z-height. Not implemented yet but doable.

waterlines

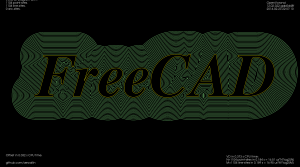
This shows offsets calculated with openvoronoi. The VD algorithm is fairly stable for input geometries with line-segments, but some corner cases still cause problems. It would be nice to have arc-segments as input also, but this requires additional work.

freecad_offsets

The VD is easily filtered down to a medial-axis, more well-known as a V-carving toolpath. I've demonstrated this for a 90-degree V-cutter, but toolpath is easy to adapt for other angles. Input geometry comes from truetype-tracer (which in turn uses FreeType).

medial_axis_v-carving

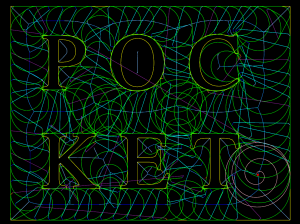
Finally there is an experimental advanced pocketing algorithm which I call medial-axis-pocketing. This is just a demonstration for now, but could be developed into an "adaptive" pocketing algorithm. These are the norm now in modern CAM packages and the idea is not to overload the cutter in corners or elsewhere - take multiple light passes instead.

ma-pocket

The real fun starts when we start composing new toolpath strategies consisting of many of these simple/basic ones. One can imagine first terrace-roughing a part using the medial-axis-pocketing strategy, then a semi-finish path using a smart shallow/steep waterline/parallel-finish algorithm, and finally a finish operation or even pencil-milling.

Photon-correlation test with modulated LED

Further testing of the time-stamping hardware. The idea was to generate a weak beam of light with an intensity modulation at 1-12 MHz, count and time-stamp the photons, and see if the modulation can be measured with a correlation histogram.

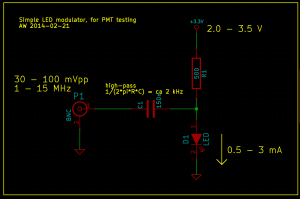
To generate a stream of photons intensity modulated at a frequency f_mod I used this simple LED circuit driven by an adjustable DC power-supply and a signal generator. I didn't test the bandwidth of the circuit and LED, but it seems to work well for this test at least up to 12 MHz.

led_modulator_2014-02-21

If we are given such a stream of photons, with an average rate of say 10 kphotons/s, how do we detect that the modulation at MHz frequencies is there? Note that the average rate of photons is much much smaller than the modulation frequency. If we receive photons at 10 kcounts/s there is on average 1000 cycles of modulation between each photon-event, when f_mod=10 MHz.

One way is to count the photons with a photon-counter, and time-stamp each photon. We should now on average see more/less photons every 1/f_mod seconds. So if we histogram all time stamps modulo 1/f_mod, we should get a sine-shaped histogram. This assumes that the signal generator creating f_mod and our time-stamping hardware share a common time-base.

This works quite nicely!

At the start of the video we see only the dark counts of the PMT. A DC voltage is then applied to the LED and the histogram rises up, but remains flat. When the modulation is applied we immediately see a sine-shape of the histogram. If we adjust the the frequency, phase, or amplitude of the modulation we see a corresponding change in the histogram.

The video first has testing at f_mod=1 MHz, with a histogram modulo 1/f_mod = 1000 ns, and later with f_mod=12 MHz and the histogram modulo 83333 ps. The later part of the video also has a least-squares sin() fit to the data.

This technique is very sensitive to mismatch between the applied frequency f_mod, and the histogram mod-time 1/f_mod. I first wanted to try this at 12 MHz, so I set the histogram mod-time to 83333 ps - and saw no sine-histogram at all! This was because I had rounded 1/f_mod to the nearest picosecond, and 1/83333 ps is actually 12 000 048 Hz - not 12 MHz!
At 12 MHz a deviation of 48 Hz is a few ppm in fractional frequency, and I later tested that changing f_mod by a fraction of ca 1e-8 makes the histogram slowly wander to the left or right. Any larger deviation and the correlation is lost.
All of this is similar to a lock-in technique, so the same principles should apply.

White Rabbit Fine-Delay time-stamp testing

I'm testing the White Rabbit Fine-Delay FMC. It has an ACAM TDC-GXP time-to-digital converter that time-stamps the leading edge of an input trigger signal with ~30 ps resolution.

Recent work by Alessandro Rubini introduced a raw_tdc=1 driver mode which on my computer is able to collect time-stamps at a maximum rate of ca 150 kHz. Each time-stamp is 24-bytes, so this corresponds to a data-stream of roughly 4 Mb/s.

The video shows two graphs that update in real-time on the machine that collects time-stamps. The first is simply a (reciprocal) frequency counter where we count how many time-stamps arrive within a certain gate/window.

The second part of the video shows a modulo(tau) histogram where we bin time-stamps modulo tau into a histogram. The histogram was calculated for tau=100 us and an input frequency of 1 kHz was used. This results in the central peak in the histogram. I then slightly increased the frequency to 1.000010 kHz which makes the peak wander to the right. The peak on the right was produced by again tuning the input frequency to exactly 1 kHz. Similarly a lower input frequency of 999.970 Hz makes the peak wander to the left, and the peak around 20us was produced after tuning back to 1 kHz.

This hardware/software combination will be useful for collecting statistics and correlations in any experiments where a pulse type detector is used to measure something - provided the pulse-rate is below 150 kHz or so.

Pulse Stretcher - v1

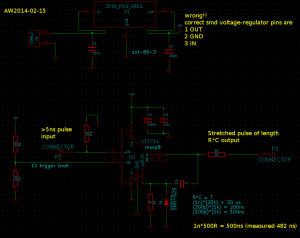
A first try at this pulse stretcher circuit based on the LT1711 comparator. I need it for stretching a short 10ns pulse from a PMT.

stretcher_sch_2014-02-13

The idea is to use the output latch of the LT1711. Once the output goes high, the combination C4 R4 keeps the latch pin (and thus the output) high for a time R*C. The Schottky diode is there to prevent the latch pin from swinging to far negative once the output goes low.

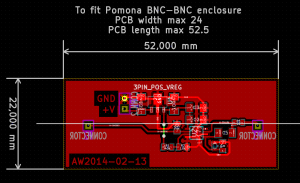
stretcher_pcb_2014-02-13

The PCB is made to fit into a BNC-BNC enclosure such as the ones from Pomona.

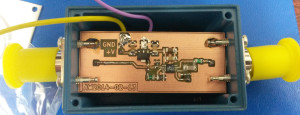
pulse_stretcher_prototype

Messing up the pin-order of voltage regulators is becoming a habit! Note how the regulator is mounted the wrong way round compared to the PCB design - because I had the pin order wrong in my schematic.

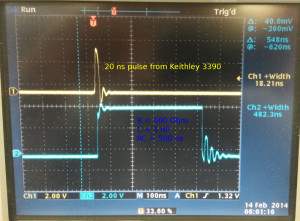
pulse_stretcher_input_output

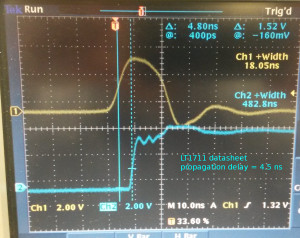
I used a Keithley 50 MHz function generator to generate a 20ns long input pulse (the shortest possible from the Keithley) and the pulse-stretcher outputs a ca 483 ns output pulse. The prototype used a 1 nF capacitor with a 500 Ohm resistor which gives a nominal time-constant of 500 ns. The output pulse duration is far from constant and varies quite a bit from pulse to pulse.

pulse_stretcher_propagation_delay

This verifies that the propagation delay of the LT1711 in this circuit is within specifications, ca 4.5 ns. In addition to the comparator there is also maybe 70 mm of BNC-connectors, wires, and PCB-traces in the signal path, but that would add only ~350 ps to the propagation delay (assuming 2e8 m/s signal velocity).

One problem with this design is that it is sensitive to the load impedance connected to the output. With a 1 MOhm setting on the oscilloscope the pulse-length is correct, but switching to a 50 Ohm load impedance allows the capacitor to discharge significantly through the load impedance.

Version 2 of this circuit should thus add an output buffer (fast, low-jitter!) that can drive both 1 MOhm and 50 Ohm loads. An adjustable trigger level for the -Input of the LT1711 comparator could also be useful.

ZeromMQ REQuest/REPly pattern

More zeromq testing. See also PUB/SUB.

This pattern is for a reply&request situation where one machine asks for data from another machine. The pattern enforces an exchange of messages like this:

REQuester always first sends, then receives.

REPlyer always first receives, then sends.

Requester

1
2
3
4
5
6
7
8
9
10
11
12
13
14
15
16
17
18
19
20
21
22
23
24
25
26
27
28
29
30
31
import zmq
import time
 
# request data from this server:port
server = "192.168.3.38"
port = 6000
 
context = zmq.Context()
socket = context.socket(zmq.REQ)
socket.connect ("tcp://%s:%s" % (server,port) )
 
while True:
    tstamp = time.time()
    msg = "%f" % tstamp # just send a timestamp
    # REQuester: TX first, then RX
    socket.send(msg)        # TX first
    rep = socket.recv() # RX second
    done = time.time()
    oneway = float(rep)-tstamp
    twoway = done - tstamp
    print "REQuest ",msg
    print "REPly   %s one-way=%.0f us two-way= %.0f us" % ( rep, 1e6*oneway,1e6*twoway )
    time.sleep(1)
 
# typical output:
# REQuest  1392043172.864768
# REPly   1392043172.865097 one-way=329 us two-way= 1053 us
# REQuest  1392043173.866911
# REPly   1392043173.867331 one-way=420 us two-way= 1179 us
# REQuest  1392043174.869177
# REPly   1392043174.869572 one-way=395 us two-way= 1144 us

The one-way delay here assumes we have machines with synchronized clocks. This might be true to within 1ms or so if both machines are close to the same NTP server.

The two-way delay should be more accurate, since we subtract two time-stamps that both come from the REQuesters system clock. Much better performance can probably be achieved by switching to C or C++.

Replyer:

1
2
3
4
5
6
7
8
9
10
11
12
13
14
15
16
17
18
19
20
21
22
23
24
25
26
import zmq
import time
 
port = 6000
context = zmq.Context()
socket = context.socket(zmq.REP)
# reply to anyone who asks on this port
socket.bind("tcp://*:%s" % port) 
 
print "waiting.."
while True:
    #  Wait for next request from client
    message = socket.recv() # RX first
    print "Received REQuest: ", message
    tstamp = time.time()
    sendmsg = "%f" % tstamp # send back a time-stamp
    print "REPlying: ",sendmsg
    socket.send(sendmsg) # TX second
 
# typical output:
# Received REQuest:  1392043244.206799
# REPlying:  1392043244.207214
# Received REQuest:  1392043245.209014
# REPlying:  1392043245.209458
# Received REQuest:  1392043246.211170
# REPlying:  1392043246.211567

ZeroMQ PUB/SUB pattern

I'm playing with zeromq for simple network communication/control. For a nice introduction with diagrams see Nicholas Piel's post "ZeroMQ an introduction"

Here is the PUBlish/SUBscribe patter, which usually consist of one Publisher and one or many Subscribers.

Publisher:

1
2
3
4
5
6
7
8
9
10
11
12
13
14
15
16
17
18
19
20
21
import zmq
from random import choice
import time
 
context = zmq.Context()
socket = context.socket(zmq.PUB)
socket.bind("tcp://*:6000") # publish to anyone listening on port 6000
 
countries = ['netherlands','brazil','germany','portugal']
events = ['yellow card', 'red card', 'goal', 'corner', 'foul']
 
while True:
    msg = choice( countries ) +" "+ choice( events )
    print "PUB-> " ,msg
    socket.send( msg ) # PUBlisher only sends messages
    time.sleep(2)
 
# output:
# PUB-> netherlands yellow card
# PUB-> netherlands red card
# PUB-> portugal corner

And here is the Subscriber:

1
2
3
4
5
6
7
8
9
10
11
12
13
14
15
16
17
18
19
import zmq
 
context = zmq.Context()
socket = context.socket(zmq.SUB)
# specific server:port to subscribe to
socket.connect("tcp://192.168.3.35:6000") 
# subscription filter, "" means subscribe to everything
socket.setsockopt(zmq.SUBSCRIBE, "") 
 
print "waiting.."
while True:
	msg = socket.recv() # SUBscriber only receives messages
	print "SUB -> %s" % msg
 
# typical output:
# waiting..
# SUB -> portugal corner
# SUB -> portugal foul

allantools

Python code for calculating Allan deviation and related statistics: https://github.com/aewallin/allantools

Sample output:
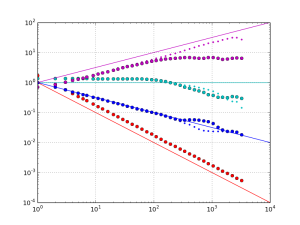
allantools_output

Cheat-sheet (see http://en.wikipedia.org/wiki/Colors_of_noise).

Phase PSD Frequency PSD ADEV
1/f^4, "Black?" 1/f^2, Brownian, random walk sqrt(tau)
1/f^3 ?, "Black?" 1/f Pink constant
1/f^2, Brownian, random walk f^0, White 1/sqrt(tau)
f^0, White f^2 Violet 1/tau

Phase PSD is frequency dependence of the the power-spectral-density of the phase noise.
Frequency PSD is the frequency dependence of the power-spectral-density of the frequency noise.
ADEV is the tau-dependence of the Allan deviation.

These can get confusing! Please comment below if I made an error!