Tuesday update: A few optimizations has shaved about half off the constant, to  . This was mainly (a) choosing boost::vecS as the out-edge container for the BGL-graph, and (b) choosing std::vector instead of std::set for a temporary variable in the grid-search for the closest facet. I suspect the runtime is dominated by that grid-search. Profiling would tell.

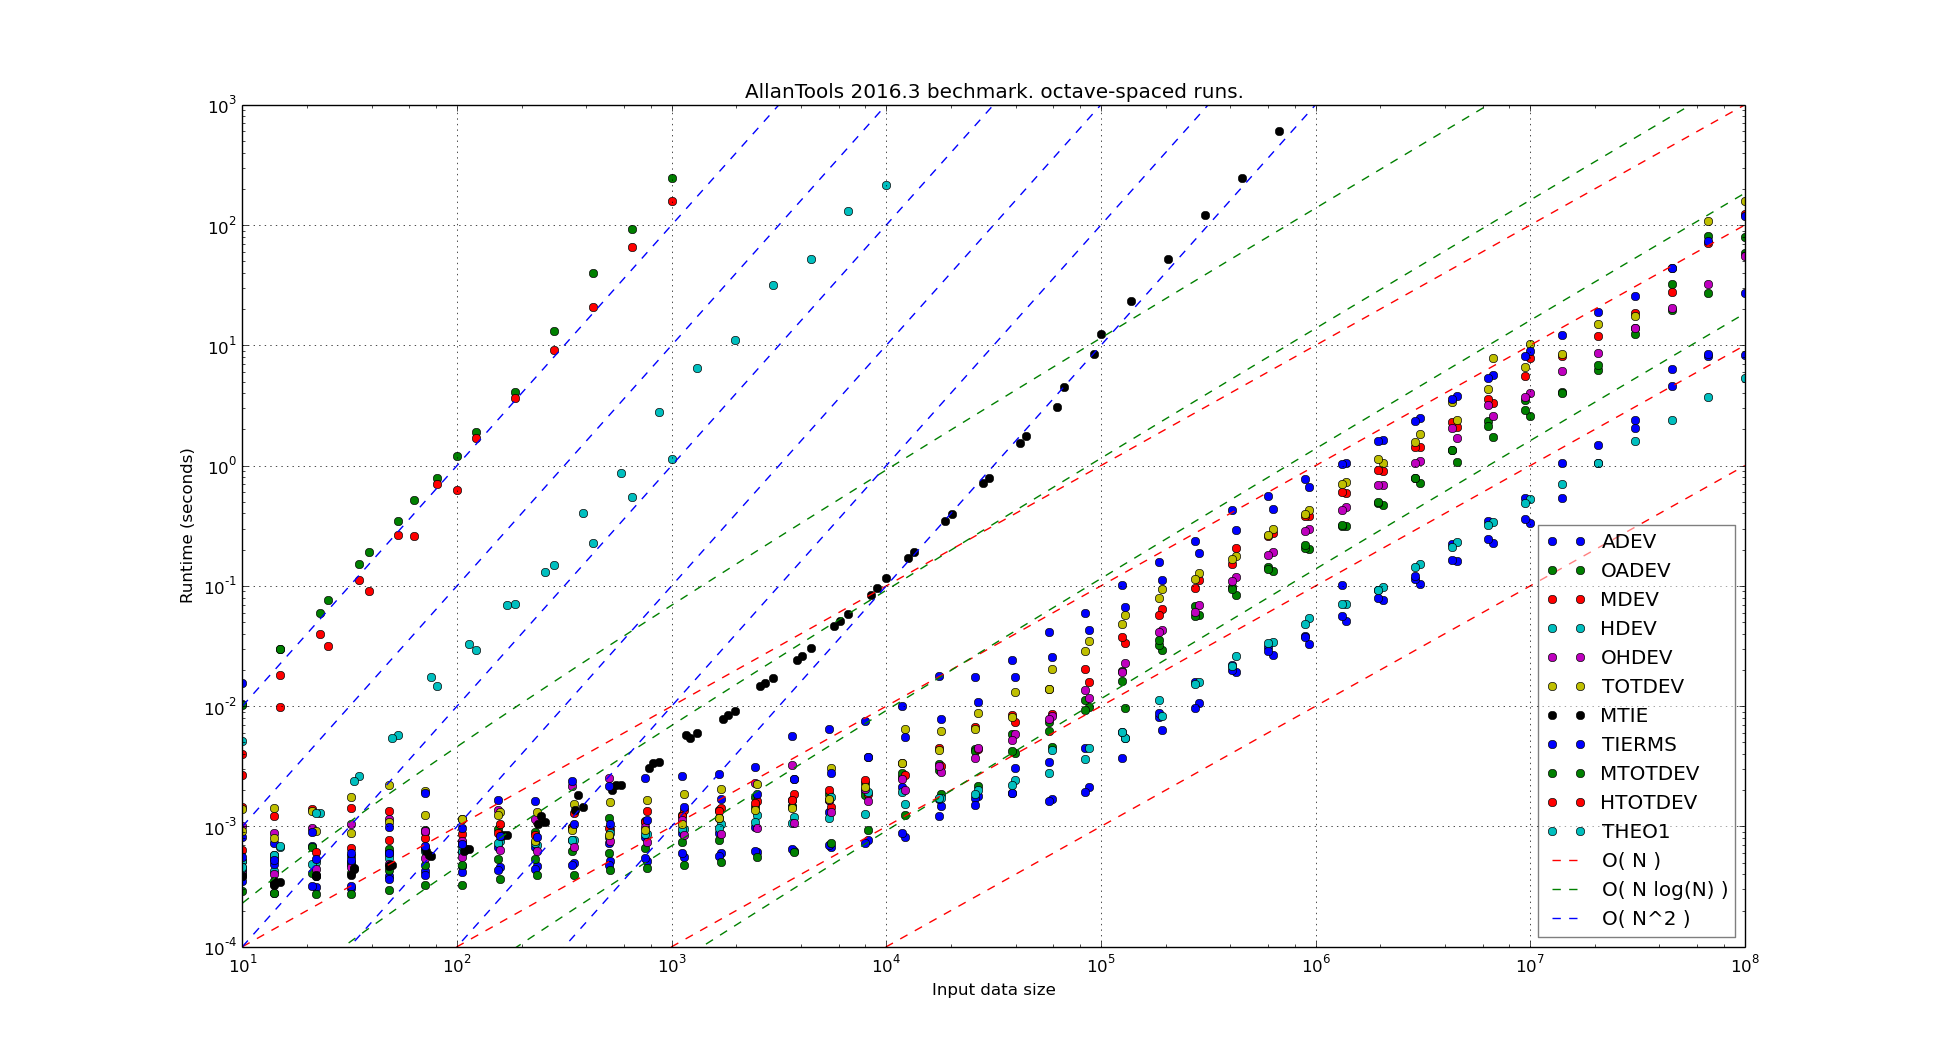
I did some benchmarking of my vd-code. It is supposed to run in  time. Benchmarking turns out to be not so simple. I normally compile without any optimizations, and with a lot of sanity-checks and assert():s all over the code. These checks have worse time-complexity and result in long runtimes with big inputs. Then there are compiler optimization flags like -O or -O3.
I was first running the algorithm by inserting each point from python-code:
    t_before = time.time()
    for p in plist:
        vd.addVertexSite( p )
    t_after = time.time()
return (t_after - t_before) |
t_before = time.time()
for p in plist:
vd.addVertexSite( p )
t_after = time.time()
return (t_after - t_before)
which I thought could add some overhead. I also made a version ("batch mode") where we first push all points to c++, and then call a run() method:
    for p in plist:
        vd.pushVertexSite( p )
    t_before = time.time()
    vd.run()
    t_after = time.time()
return (t_after - t_before) |
for p in plist:
vd.pushVertexSite( p )
t_before = time.time()
vd.run()
t_after = time.time()
return (t_after - t_before)
but this seems to improve runtime only marginally. Here are the results. Runtimes are divided by  , so ideally all points should fall on a horizontal line. At best the code now runs in about 10-16 microseconds times .

With 4096 input points the runtime improves from 12s down to 1.3s by turning off sanity-checks and assert():s. It further improves to 0.18s with -O3 and to 0.165s in batch-mode.
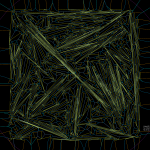
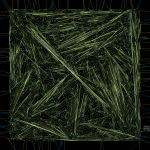
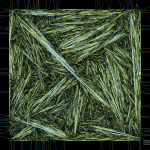
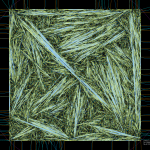
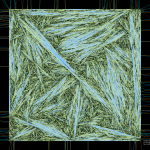
As an example, the voronoi diagram for 1000 random points looks like this:

 See also: numpy vs pure python comparison from 2014 August.