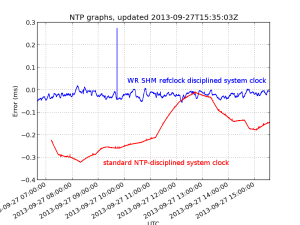
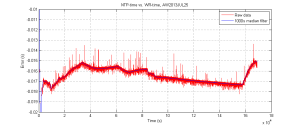
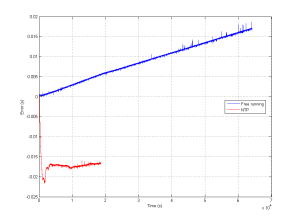
Update: Here's how the graph looks like when NTP traffic is enabled again:

A computer that doesn't receive NTP traffic for a while will have its system time drift quite a lot.
In the absence of NTP (UDP port 123) traffic, we can try to roughly ask for the current time over HTTP using wget from google with this shell script:
#!/bin/sh
/usr/bin/wget --no-cache -S -O /dev/null google.com 2>&1 | \
/bin/sed -n -e '/ *Date: */ {' -e s///p -e q -e '}' |
#!/bin/sh
/usr/bin/wget --no-cache -S -O /dev/null google.com 2>&1 | \
/bin/sed -n -e '/ *Date: */ {' -e s///p -e q -e '}'
This outputs a string such as "Sat, 23 Nov 2013 09:14:45 GMT"
Now we can put together a python script that calls this shell script, converts the text-format time-stamp into UTC seconds, and compares against the system time. For plotting we then store the time-error in an RRDTool database. This script is called once per minute using cron.
import subprocess
import time
import datetime
import rrdtool
import syslog

args = ['googletime.sh']
datetimestring = subprocess.check_output(args)
syslog.syslog( "googletime {0}".format(datetimestring))

# input: Sat, 23 Nov 2013 09:18:02 GMT
# output: 1385191082.0  (seconds since 1.1.1970)
timestamp = time.mktime( time.strptime(datetimestring, '%a, %d %b %Y %H:%M:%S GMT\n'))

# system time, e.g.: 1385191082.0
stime = time.mktime( time.gmtime() )

# should be zero, if all is well
terror = stime-timestamp

# store the measured error in a database
datastring = 'N:{0}'.format(str(terror)) # 'N:1234'
syslog.syslog( "rrd update: {0}".format(datastring) )
ret = rrdtool.updatev( "time_error.rrd" ,datastring)
syslog.syslog( "rrd updatev: {0}".format(ret) ) |
import subprocess
import time
import datetime
import rrdtool
import syslog
args = ['googletime.sh']
datetimestring = subprocess.check_output(args)
syslog.syslog( "googletime {0}".format(datetimestring))
# input: Sat, 23 Nov 2013 09:18:02 GMT
# output: 1385191082.0 (seconds since 1.1.1970)
timestamp = time.mktime( time.strptime(datetimestring, '%a, %d %b %Y %H:%M:%S GMT\n'))
# system time, e.g.: 1385191082.0
stime = time.mktime( time.gmtime() )
# should be zero, if all is well
terror = stime-timestamp
# store the measured error in a database
datastring = 'N:{0}'.format(str(terror)) # 'N:1234'
syslog.syslog( "rrd update: {0}".format(datastring) )
ret = rrdtool.updatev( "time_error.rrd" ,datastring)
syslog.syslog( "rrd updatev: {0}".format(ret) )
Once we have all the values in our time_error.rrd database we can plot them with rrdtool graph. This is what I get:
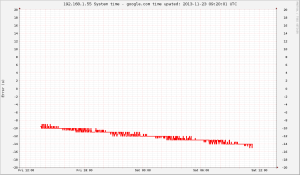
There is about -4 seconds of drift during 24 hours, or 46 us/s (46 ppm). If the drift is steady we can guess that the computer was on time 14/4 = ~4 days ago.
The script for creating the rrdtool database is this:
import rrdtool
import time

# DS:ds-name:GAUGE | COUNTER | DERIVE | ABSOLUTE:heartbeat:min:max
data_sources=[ 'DS:TERROR:GAUGE:70:U:U']
# RRA:AVERAGE | MIN | MAX | LAST:xff:steps:rows

utcsecs = int( time.time() )
pts_day= 24*60
primary = 'RRA:AVERAGE:0.5:1:{0}'.format(pts_day) # 2016 points
rrdtool.create( 'time_error.rrd',           # filename
                 '--start', str(utcsecs),   # when to start
                 '--step', '60',            # step between datapoints
                 data_sources,
primary) |
import rrdtool
import time
# DS:ds-name:GAUGE | COUNTER | DERIVE | ABSOLUTE:heartbeat:min:max
data_sources=[ 'DS:TERROR:GAUGE:70:U:U']
# RRA:AVERAGE | MIN | MAX | LAST:xff:steps:rows
utcsecs = int( time.time() )
pts_day= 24*60
primary = 'RRA:AVERAGE:0.5:1:{0}'.format(pts_day) # 2016 points
rrdtool.create( 'time_error.rrd', # filename
'--start', str(utcsecs), # when to start
'--step', '60', # step between datapoints
data_sources,
primary)
And the graph is created by this script. I am using the simple python-rrdtool python bindings - the object-oriented python-pyrrd may have neater syntax and be more pythonic.
import rrdtool
import time

graphname = '/var/www/test.png'
day = 24*3600
span = 1*day
starttime = int(time.time()-span)
endtime = int( time.time() + 0.1*span)
updatestamp = time.strftime("%Y-%m-%d %H:%M:%S UTC", time.gmtime(time.time()))
graphtitle = '192.168.1.55 System time - google.com time upated: '+updatestamp
rrdtool.graph(  graphname,
               '--start', str(starttime),
               '--end',str(endtime),
               '--title',graphtitle,
               '--width',str(1024),
               '--height',str(600),
               '--full-size-mode',
               '--upper-limit',str(20),
               '--lower-limit',str(-20),
               '--vertical-label','Error (s)',
               '--right-axis', '1:0',
               'DEF:terror=time_error.rrd:TERROR:AVERAGE',
'LINE2:terror#FF0000') |
import rrdtool
import time
graphname = '/var/www/test.png'
day = 24*3600
span = 1*day
starttime = int(time.time()-span)
endtime = int( time.time() + 0.1*span)
updatestamp = time.strftime("%Y-%m-%d %H:%M:%S UTC", time.gmtime(time.time()))
graphtitle = '192.168.1.55 System time - google.com time upated: '+updatestamp
rrdtool.graph( graphname,
'--start', str(starttime),
'--end',str(endtime),
'--title',graphtitle,
'--width',str(1024),
'--height',str(600),
'--full-size-mode',
'--upper-limit',str(20),
'--lower-limit',str(-20),
'--vertical-label','Error (s)',
'--right-axis', '1:0',
'DEF:terror=time_error.rrd:TERROR:AVERAGE',
'LINE2:terror#FF0000')
