We got a new 53230A counter to the lab, so I decided to run some basic tests on it.
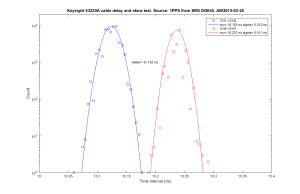
I collected time interval data using a 1-PPS source (H-maser through a SRS DG645), and wired this with a T-connector from CH1 to CH2 with a ~1 m (10 ns delay) cable. This should show the noise floor for time interval measurements as well as CH1/CH2 timing skew when measured the other way around (i.e. from CH2 to CH1). The 10 MHz external reference (at the back) was connected to a H-maser.

The results show standard deviations of 12 ps (CH1->CH2) and 11 ps (CH2->CH1) respecively, with a channel skew of 112 ps. Compare to the single-shot spec of sqrt(2)*20 ps = 28 ps and Agilent/Keysight's marketing video on youtube.
I also collected 10 MHz frequency counter readings on CH1 (source: H-maser) with gate times of 0.1 s, 1.0 s, and 10.0 s. I collected the data with a simple program that just calls the "READ?" function repeatedly, which does result in some dead-time between measurements.
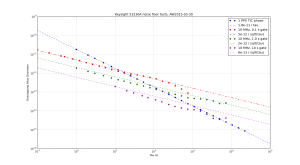
Here are the results in terms of Allan deviation. I used allantools.
The time interval noise floor looks like white phase noise with an Allan deviation of 1.8e-11/tau. This is consistent with the 12 ps RMS value found above. It is left as an exercise for the reader to show that ADEV(1s) = sqrt(3)*RMS-time-interval-noise (correct??).
The frequency counting noise floor depends on the gate time, and I get 5e-12/sqrt(tau), 2e-12/sqrt(tau), and 6e-13/sqrt(tau) for gate times of 0.1 s, 1.0 s, and 10.0 s, respectively. This looks like white frequency noise. Enrico Rubiola has notes on frequency counters that may explain the numbers.
