As mentioned before, the Chi-Squared inverse cumulative distribution is used when calculating confidence intervals in allantools.
When comparing computed confidence intervals against Stable32, there seems to be some systematic offsets, which I wanted to investigate.
While allantools uses scipy.stats.chi2.ppf(), It turns out that Stable32 uses an iterative method for EDF<=100, and an approximation from Abramowitz and Stegun: Handbook of Mathematical Functions for EDF>100. This 1964 book seems to be available online from many sites. The approximation (for large EDF) for the inverse chi-squared cumulative distribution is equations 26.4.17 (p410 in the PDF) (here nu is the equivalent degrees of freedom)

Where xp is from the inverse of the Normal cumulative distribution, computed via the approximation 26.2.22 (p404 in the PDF)
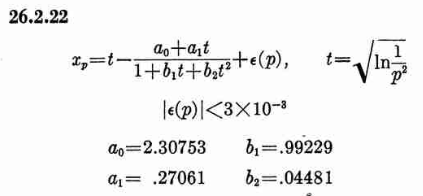
It also looks like the Stable32 source contains a misprint, where the a1 coefficient of 26.2.22 is used with two digits in the wrong order! (I did promise 'fun' in the title of this post!)
a1=0.27601 # typo in the Stable32 source code!? should be 0.27061If we plot both scipy.stats.chi2.ppf() and the Stable32 implementation for various EDF and probabilities we get the following:
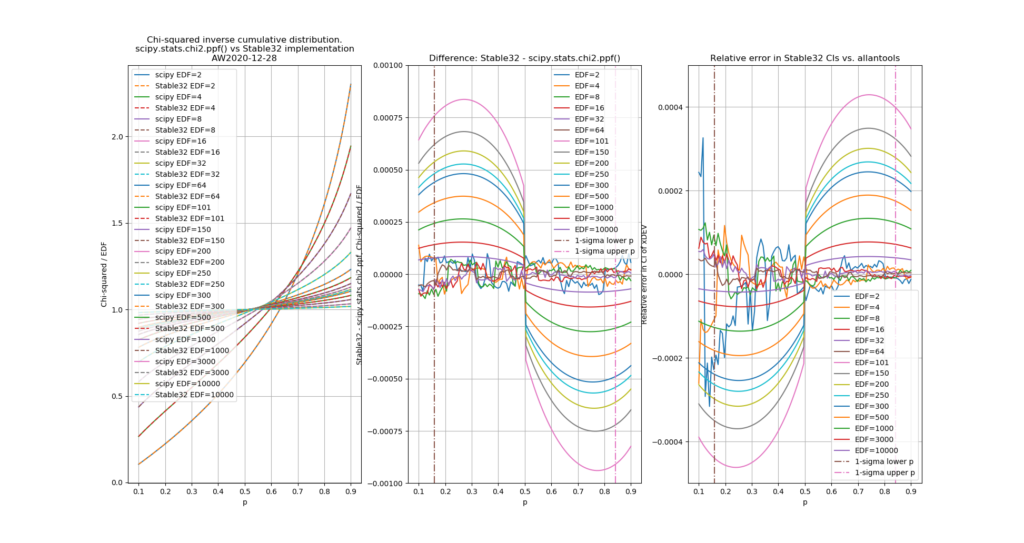
The leftmost figure shows Chi-Squared values (divided by EDF, to overlap all curves). There's not much difference between scipy and Stable32 visible at this scale. The middle figure shows the difference between the two algorithms. This shows very clearly the small (<100) EDF-region where the iterative algorithm in Stable32 produces a Chi-squared value in agreement with scipy to better than 4 digits (see the noisy traces around zero). This plot also reveals the shortcomings of the Abramovitz & Stegun approximation, together with the source-code misprint. The errors are largest, up to almost 1e-3 (in chi-squared/EDF) for EDF=101, and decrease with higher EDF. The rightmost figure shows what impact this has on computed confidence intervals - shown as relative errors. The confidence interval is proportional to sqrt(EDF/chi-squared). The dashed lines show the probabilities corresponding to 1-sigma confidence intervals, where we usually sample this function.
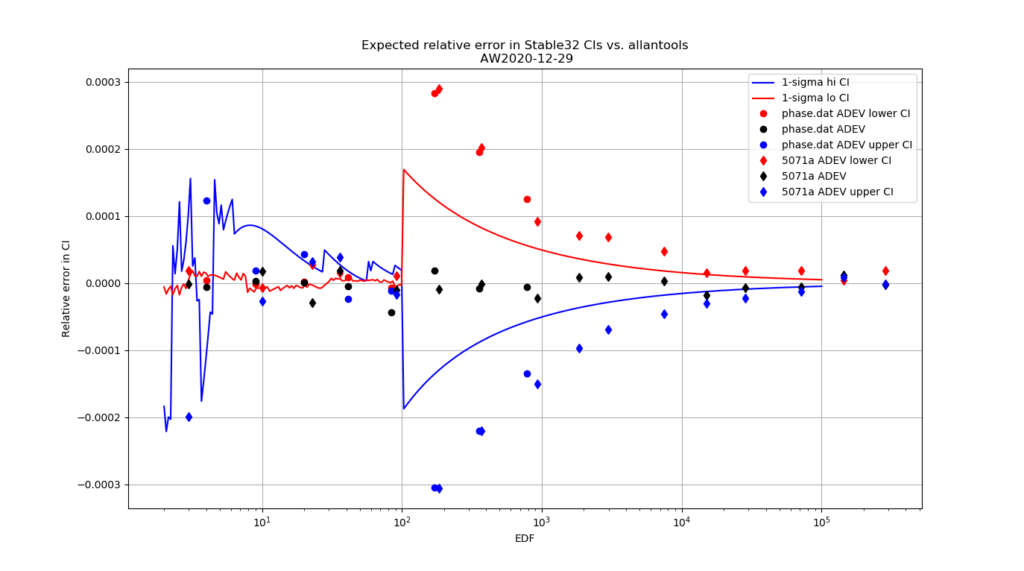
For 1-sigma confidence intervals we can now compare computed results with Stable32 and allantools to the comparison above of scipy and Abramovitz&Stegun + misprint.
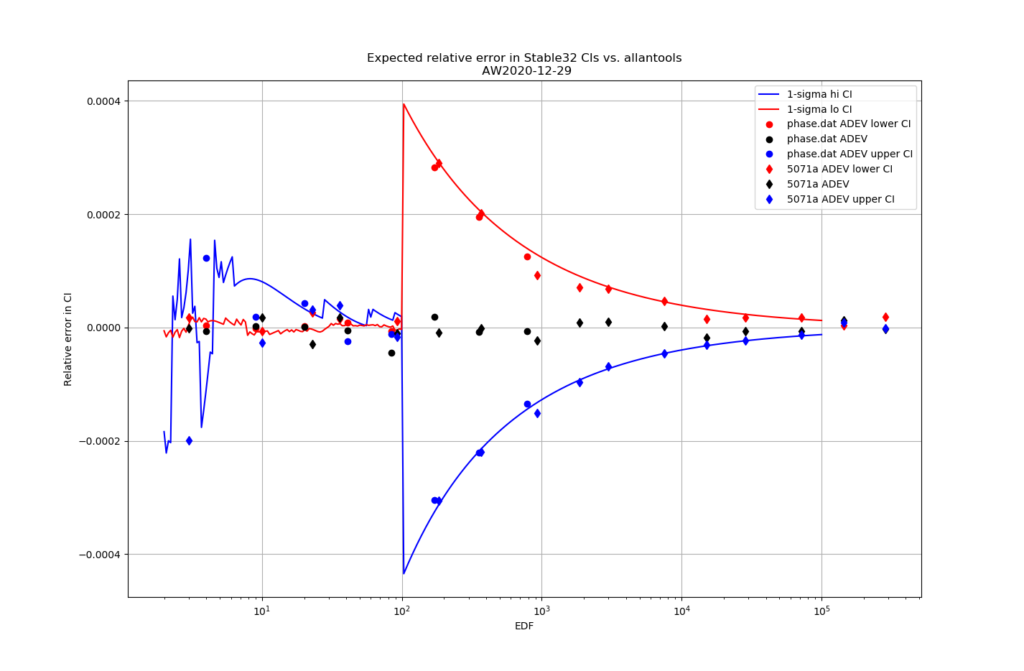
Are we having fun yet!? The comparison above between the two methods to compute the inverse chi-squared cumulative distribution seems to predict how Stable32 confidence intervals differ from allantools confidence intervals quite well! Note that Stable32 results are copy/pasted from the GUI with 5 significant digits, so some noise at the 1e-4 level is to be expected. Note that the relative error has a different sign depending on if we look at the lower or upper bound, and also depending on if we use the EDF<=100 iterative algorithm or the EDF>100 Abramovitz&Stegun+misprint approximation. For large EDF the upper bound (blue) of Stable32 is a bit too low, while the lower bound (red) is a bit too high.
Finally, the chi-squared figure and the expected confidence interval relative error figure, if we fix the misprint in the a1 coefficient:
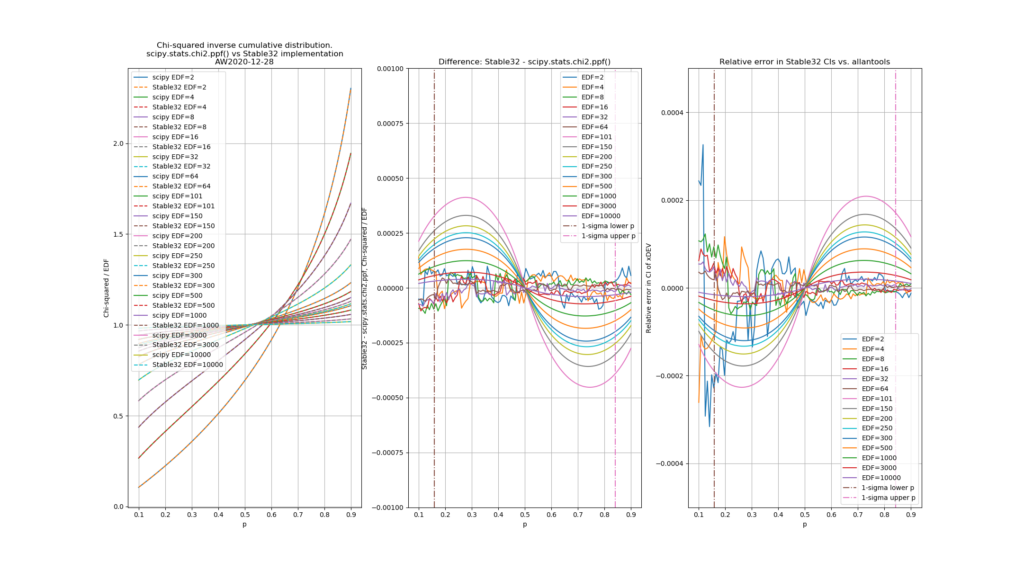
Python code for producing these figures is available: chi2_stable32.py
The approximations used by Stable32 are not (yet?) included in allantools.