Optical tweezers use light to trap dielectric particles in an approximately harmonic potential. If the position of the bead is X, the position of the trap Xtrap, and the stiffness of the trap k then the equation of motion looks like this:
where Beta is the drag coefficient and Ft is a random white-noise thermal force (the bead is so small that kicks and bumps by surrounding water-molecules matter!). If the trap stays in one place all the time (Xtrap is constant) the power-spectral-density (PSD) of the bead fluctuations turns out to be Lorentzian.
But if there's a fast way of steering the trap, we might try feedback control where we actively steer Xtrap based on some feedback signal:
This is a position-clamp where we use proportional feedback with gain Kp to keep the bead bead at some fixed set-point Xset. Tau accounts for some delay in measuring the bead position and in steering the trap. Inspired by a magnetic-tweezers paper by Gosse et al. we inserted this into the equation of motion to find the PSD:
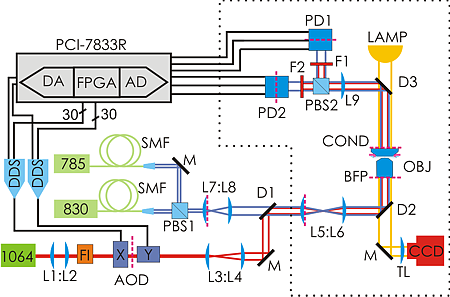
So how do we go about verifying this experimentally? Well, you build something like this:
The idea is to use a powerful laser at 1064 nm for trapping. It can be steered with about a 10 us delay using AODs. Then we use another laser at 830 nm to detect the position of the trapped particle using back-focal-plane interferometry. But since in-loop measurements in feedback loops can give funny results it's best to verify the position measurement with a third laser at 785 nm. The feedback control is performed by a PCI-7833R DAQ card from National Instruments which houses an AD converter for reading in the position signals at 200 kS/s and 16-bit precision, and then we do the feedback algorithm on a 3 Mgate FPGA. We output the steering command as 30 bit numbers in parallel to DDSs that drive the AODs. The 10 us delay in the AOD (the acoustic time-of-flight in the crystal) combined with the AD-conversion time of 5 us gives a total loop-delay of around 15 us in our setup.
It all works quite nicely! The colored PSD traces are experimental data at increasing feedback gain starting from the blue trace at the top (zero gain, Lorentzian shape as expected) down to the black trace at the bottom (gain 24.8). When increasing the gain further trapping becomes unstable due to the peak at ~12 kHz (think about what's usually termed 'feedback': pointing a microphone at a loudspeaker). The theoretical PSDs are shown as solid lines and they agree pretty well with the experiment. The inset shows the effective trap stiffness calculated from the integral of the PSD. We're able to increase the lateral effective trap stiffness around 10-13 fold compared to the no-feedback situation.
This video shows a time-series of the bead position (left) and the trap position (right) first with no feedback where we see the bead fluctuating a lot and the trap stationary, and then with feedback gain applied (gain=7) where we see the bead-noise significantly reduced and the trap moving around.
These results appear as a 3-page write-up in today's Applied Physics Letters:
A.E. Wallin, H. Ojala, E. Haeggström, and R. Tuma, "Stiffer optical tweezers through real-time feedback control", Applied Physics Letters 92 (22) 224104 (2008) (doi:10.1063/1.2940339)
We're not the first ones to perform this experiment, but I would argue that our paper is the first one to do all steps in the experiment properly, and we get the nice agreement between theory and experiment.
An early paper by Simmons et al. claims a 400-fold improvement in effective trap stiffness using an analog feedback circuit. There's no discussion about the feedback bandwidth or the PSD when position-clamping. Perhaps a case of undersampling?
Simulations by Ranaweera et al. indicate that a 65-fold increase in effective trap stiffness can be achieved, but there's no discussion about how the delays in the feedback loop affect this, and there's no experimental verification.
More recently, Wulff et al. used steering mirrors to do the same thing, but they used the position detection signal from the trapping laser itself for feedback control. I'm not sure what this achieves since the coordinate-system in which you do position measurements is going to be steered around as you try to minimize fluctuations. Their PSDs don't look like ours, and the steering mirror has a bandwidth of only a few hundred Hz so you cannot control the high frequency noise like this.
Increasing the stiffness of optical tweezers by other means seems like a fashionable topic. A recent paper from Alfons van Blaaderen's group uses counter propagating beams to trap high-index (n>2) particles effectively, while simulations by Halina Rubinsztein-Dunlop's group indicate that anti-reflection coating the beads also improves trapping efficiency.


