1
2
3
4
5
6
7
8
9
10
11
12
13
14
15
16
17
18
19
20
21
22
23
24
25
26
27
28
29
30
31
32
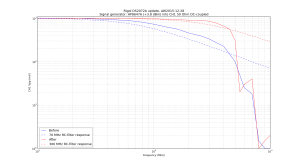
| import matplotlib.pyplot as plt
import math
# rigol ds2072a frequency response test
# AW2015-12-28
bf=[10, 20, 40, 60, 70, 80, 100, 130, 160, 200, 250, 300, 400, 500, 600, 700, 800, 900, 1000]
before=[1008, 992, 944, 880, 848, 808, 728, 624, 560, 456, 396, 332, 224, 100, 25, 18, 1.5, 1, 1]
af=[10, 20, 40, 60, 70, 80, 100, 130, 160, 200, 250, 300, 350, 400, 450, 500, 550, 600, 700, 800, 900, 1000 ]
after=[1000, 984, 984, 984, 992, 976, 976, 944, 928, 904, 888, 856, 760, 656, 556, 308, 20, 30, 40, 1, 1.5, 2]
# for comparison RC-filter response for 70MHz and 300MHz
rc70 = [ 1000.0 / math.sqrt( 1+ pow( f/70.0, 2 ) ) for f in bf]
rc300 = [ 1000.0 / math.sqrt( 1+ pow( f/300.0, 2 ) ) for f in bf]
plt.figure()
plt.loglog(bf, before,'b',label='Before')
plt.loglog(bf, rc70 ,'b--',label='70 MHz RC-filter response')
plt.loglog(af, after,'r',label='After')
plt.loglog(bf, rc300,'r--',label='300 MHz RC-filter response')
plt.title('Rigol DS2072A update, AW2015-12-28\nSignal generator: HP8647A (+3.8 dBm) into CH1 50 Ohm DC-coupled')
plt.ylabel('CH1 Vpp (mV)')
plt.xlabel('Frequency (MHz)')
plt.grid(True, which="both")
plt.ylim((1,1100))
plt.legend(framealpha=0.6, loc='lower left')
plt.show() |
