scipy.stats.chi2.ppf() without scipy

Allantools has a dependence on scipy because it uses scipy.stats.chi2.ppf() (inverse of the chi-squared cumulative distribution function) in the code for confidence intervals.

When testing scipy takes quite a long time to install and the whole package seems a bit overkill for just this one function.

So I tried implementing it using just numpy. It sort of works, but not for corner cases where p is very close to 1.0 or k is a big number. I get for example:

    top = pow(x, s)*math.exp(-x)*pow(x,k)
OverflowError: (34, 'Numerical result out of range')

Maybe there's something trick when numerically evaluating lower_gamma() using the series expansion that I am missing...

import scipy.stats
import math
import numpy
 
def bisection(function, k, p, a, b, tol):
	# http://code.activestate.com/recipes/578417-bisection-method-in-python/
	assert (function(a,k)-p)*(function(b,k)-p) < 0 # a, b must bracket root
	c = (a+b)/2.0
	while (b-a)/2.0 > tol:
		if (function(c, k)-p) == 0:
			return c
		elif (function(a,k)-p)*(function(c,k)-p) < 0:
			b = c
		else :
			a = c
		c = (a+b)/2.0
	return c
 
def lower_gamma(s,x):
	# lower incomplete gamma function
	# https://en.wikipedia.org/wiki/Incomplete_gamma_function#Evaluation_formulae
	g  = 0
	last_g = 1.0
	done = False
	tol = 1.0e-6
	k=0
	while not done:
		top = pow(x, s)*math.exp(-x)*pow(x,k)
		bot = numpy.prod( [float(s+j) for j in range(k+1) ] )
		dg = float(top)/float(bot)
		if dg == float("Inf"):
			break
		g += dg
		k += 1
		if k>100: # get at least 100 terms in the sum
			if g==0:
				break
			delta = abs(dg/g)
			if delta == float("Inf"):
				break
			if delta < tol:
				done = True
		last_g = g
	return g
 
def chi2_cdf(x, k):
	# chi-squared cumulative density function
	# cdf(x; k) = lower_gamma(k/2, x/2) / gamma(k/2)
	return lower_gamma(k/2.0, x/2.0) / math.gamma(k/2.0)
 
def chi2_ppf(p, k):
	# chi-squared Percent point function (inverse of cdf percentiles).
	# look for x such that
	# p = chi2_cdf( x=chi2_ppf(p, k), k)
	tol = 1e-8
	lolim = 0
	hilim = k
	while (chi2_cdf(lolim,k)-p)*(chi2_cdf(hilim,k)-p) > 0: 
		hilim *= 1.5
	return bisection( chi2_cdf, k, p, lolim, hilim, tol)
 
print "scipy cdf: ",scipy.stats.chi2.cdf(55, 33)	
print "own   cdf: ",chi2_cdf(55, 33)
 
 
print "scipy ppf ", scipy.stats.chi2.ppf(0.4, 33)
print "  own ppf ", chi2_ppf(0.4, 33)
 
# test that we really found the inverse
print scipy.stats.chi2.cdf(scipy.stats.chi2.ppf(0.4, 33), 33)
print chi2_cdf( chi2_ppf(0.4, 33), 33 )
 
# try to check the scipy function against our own function
# for some random input of (p, k)
for n in range(100):
	k = numpy.random.randint(20, 200)
	p = numpy.random.random()
	print k, p,
	a=scipy.stats.chi2.ppf(p, k)
	b=chi2_ppf(p, k)
	ok = numpy.isclose(a, b)
	if ok:
		print  ok
	else:
		print  ok, a, b
	assert ok

Leap second time-stamps for leap-seconds.list

This function generates time-stamps in the format used in leap-seconds.list (on e.g. NTP or PTP servers). The format is integer seconds since 1900-01-01T00:00+00.

import datetime
import pytz
 
 
def generate_ntp_timestamp(year,month,day,hour,minute,second):
    t = datetime.datetime(year,month,day,hour,minute,second,tzinfo=pytz.utc)
    #NTP leap-seconds list wants seconds since 1900
    epoch_start = datetime.datetime(1900,1,1,0,0,0,tzinfo=pytz.utc)
    delta = t-epoch_start
    delta_s = delta.total_seconds()
    return int(delta_s)
 
 
# test that this generates OK values.
# from existing leap-seconds.list
# 2918937600	27	# 1 Jul 1992
# 2950473600	28	# 1 Jul 1993
# 2982009600	29	# 1 Jul 1994
# 3029443200	30	# 1 Jan 1996
# 3076704000	31	# 1 Jul 1997
# 3124137600	32	# 1 Jan 1999
# 3345062400	33	# 1 Jan 2006
# 3439756800	34	# 1 Jan 2009
print "1 Jan 2009: ", generate_ntp_timestamp(2009,1,1,0,0,0)
print "1 Jan 2006: ", generate_ntp_timestamp(2006,1,1,0,0,0)
print "1 Jul 1997: ", generate_ntp_timestamp(1997,7,1,0,0,0)
#output:
#1 Jan 2009:  3439756800
#1 Jan 2006:  3345062400
#1 Jul 1997:  3076704000

Clock display with Python and Tkinter

On github: https://github.com/aewallin/digiclock

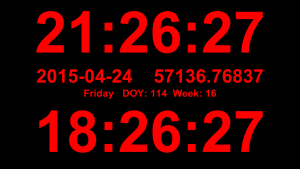
clock_display_2015-04-24

A simple clock display with local time, UTC, date (iso8601 format of course!), MJD, day-of-year, and week number. Useful as a permanent info-display in the lab - just make sure your machines are synced with NTP.

1
2
3
4
5
6
7
8
9
10
11
12
13
14
15
16
17
18
19
20
21
22
23
24
25
26
27
28
29
30
31
32
33
34
35
36
37
38
39
40
41
42
43
44
45
46
47
48
49
50
51
52
53
# use Tkinter to show a digital clock
# tested with Python24    vegaseat    10sep2006
# https://www.daniweb.com/software-development/python/code/216785/tkinter-digital-clock-python
# http://en.sharejs.com/python/19617
 
# AW2015-04-24
# added: UTC, localtime, date, MJD, DOY, week 
from Tkinter import *
import time
import jdutil # https://gist.github.com/jiffyclub/1294443
 
root = Tk()
root.attributes("-fullscreen", True) 
# this should make Esc exit fullscrreen, but doesn't seem to work..
#root.bind('',root.attributes("-fullscreen", False))
root.configure(background='black')
 
#root.geometry("1280x1024") # set explicitly window size
time1 = ''
clock_lt = Label(root, font=('arial', 230, 'bold'), fg='red',bg='black')
clock_lt.pack()
 
date_iso = Label(root, font=('arial', 75, 'bold'), fg='red',bg='black')
date_iso.pack()
 
date_etc = Label(root, font=('arial', 40, 'bold'), fg='red',bg='black')
date_etc.pack()
 
clock_utc = Label(root, font=('arial', 230, 'bold'),fg='red', bg='black')
clock_utc.pack()
 
def tick():
    global time1
    time2 = time.strftime('%H:%M:%S') # local
    time_utc = time.strftime('%H:%M:%S', time.gmtime()) # utc
    # MJD
    date_iso_txt = time.strftime('%Y-%m-%d') + "    %.5f" % jdutil.mjd_now()
    # day, DOY, week
    date_etc_txt = "%s   DOY: %s  Week: %s" % (time.strftime('%A'), time.strftime('%j'), time.strftime('%W'))
 
    if time2 != time1: # if time string has changed, update it
        time1 = time2
        clock_lt.config(text=time2)
        clock_utc.config(text=time_utc)
        date_iso.config(text=date_iso_txt)
        date_etc.config(text=date_etc_txt)
    # calls itself every 200 milliseconds
    # to update the time display as needed
    # could use &gt;200 ms, but display gets jerky
    clock_lt.after(20, tick)
 
tick()
root.mainloop()

This uses two small additions to jdutil:

1
2
3
4
5
6
7
def mjd_now():
    t = dt.datetime.utcnow()
    return dt_to_mjd(t)
 
def dt_to_mjd(dt):
    jd = datetime_to_jd(dt)
    return jd_to_mjd(jd)

Faster allantools with numpy

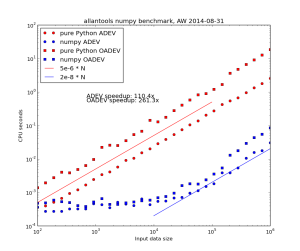
Update: these slopes are both linear, or O(n), where n is the input data size.

allantools_adev_bench_linear

However for the worst performing algorithm, MTIE, an O(n*log(n)) algorithm that uses a binary tree to store intermediate results is possible. This algorithm restricts the tau-values to 2**k (with k integer) times the data interval.

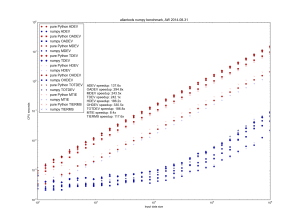
allantools_numpy_bench_2014-08-31

Danny Price has made a fantastic contribution to allantools  by taking my previous pure python code (hacked together in January 2014, shown in red) and numpyifying it all (shown in blue)!

For large datasets the speedups are 100-fold or more in most cases!
The speedups are calculated only for datasets larger than 1e5, since python's time.time() doesn't seem suitable for measuring 1 ms or shorter running times.

ZeromMQ REQuest/REPly pattern

More zeromq testing. See also PUB/SUB.

This pattern is for a reply&request situation where one machine asks for data from another machine. The pattern enforces an exchange of messages like this:

REQuester always first sends, then receives.

REPlyer always first receives, then sends.

Requester

1
2
3
4
5
6
7
8
9
10
11
12
13
14
15
16
17
18
19
20
21
22
23
24
25
26
27
28
29
30
31
import zmq
import time
 
# request data from this server:port
server = "192.168.3.38"
port = 6000
 
context = zmq.Context()
socket = context.socket(zmq.REQ)
socket.connect ("tcp://%s:%s" % (server,port) )
 
while True:
    tstamp = time.time()
    msg = "%f" % tstamp # just send a timestamp
    # REQuester: TX first, then RX
    socket.send(msg)        # TX first
    rep = socket.recv() # RX second
    done = time.time()
    oneway = float(rep)-tstamp
    twoway = done - tstamp
    print "REQuest ",msg
    print "REPly   %s one-way=%.0f us two-way= %.0f us" % ( rep, 1e6*oneway,1e6*twoway )
    time.sleep(1)
 
# typical output:
# REQuest  1392043172.864768
# REPly   1392043172.865097 one-way=329 us two-way= 1053 us
# REQuest  1392043173.866911
# REPly   1392043173.867331 one-way=420 us two-way= 1179 us
# REQuest  1392043174.869177
# REPly   1392043174.869572 one-way=395 us two-way= 1144 us

The one-way delay here assumes we have machines with synchronized clocks. This might be true to within 1ms or so if both machines are close to the same NTP server.

The two-way delay should be more accurate, since we subtract two time-stamps that both come from the REQuesters system clock. Much better performance can probably be achieved by switching to C or C++.

Replyer:

1
2
3
4
5
6
7
8
9
10
11
12
13
14
15
16
17
18
19
20
21
22
23
24
25
26
import zmq
import time
 
port = 6000
context = zmq.Context()
socket = context.socket(zmq.REP)
# reply to anyone who asks on this port
socket.bind("tcp://*:%s" % port) 
 
print "waiting.."
while True:
    #  Wait for next request from client
    message = socket.recv() # RX first
    print "Received REQuest: ", message
    tstamp = time.time()
    sendmsg = "%f" % tstamp # send back a time-stamp
    print "REPlying: ",sendmsg
    socket.send(sendmsg) # TX second
 
# typical output:
# Received REQuest:  1392043244.206799
# REPlying:  1392043244.207214
# Received REQuest:  1392043245.209014
# REPlying:  1392043245.209458
# Received REQuest:  1392043246.211170
# REPlying:  1392043246.211567

ZeroMQ PUB/SUB pattern

I'm playing with zeromq for simple network communication/control. For a nice introduction with diagrams see Nicholas Piel's post "ZeroMQ an introduction"

Here is the PUBlish/SUBscribe patter, which usually consist of one Publisher and one or many Subscribers.

Publisher:

1
2
3
4
5
6
7
8
9
10
11
12
13
14
15
16
17
18
19
20
21
import zmq
from random import choice
import time
 
context = zmq.Context()
socket = context.socket(zmq.PUB)
socket.bind("tcp://*:6000") # publish to anyone listening on port 6000
 
countries = ['netherlands','brazil','germany','portugal']
events = ['yellow card', 'red card', 'goal', 'corner', 'foul']
 
while True:
    msg = choice( countries ) +" "+ choice( events )
    print "PUB-> " ,msg
    socket.send( msg ) # PUBlisher only sends messages
    time.sleep(2)
 
# output:
# PUB-> netherlands yellow card
# PUB-> netherlands red card
# PUB-> portugal corner

And here is the Subscriber:

1
2
3
4
5
6
7
8
9
10
11
12
13
14
15
16
17
18
19
import zmq
 
context = zmq.Context()
socket = context.socket(zmq.SUB)
# specific server:port to subscribe to
socket.connect("tcp://192.168.3.35:6000") 
# subscription filter, "" means subscribe to everything
socket.setsockopt(zmq.SUBSCRIBE, "") 
 
print "waiting.."
while True:
	msg = socket.recv() # SUBscriber only receives messages
	print "SUB -> %s" % msg
 
# typical output:
# waiting..
# SUB -> portugal corner
# SUB -> portugal foul

allantools

Python code for calculating Allan deviation and related statistics: https://github.com/aewallin/allantools

Sample output:
allantools_output

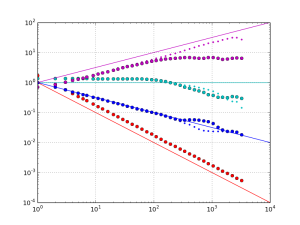
Cheat-sheet (see http://en.wikipedia.org/wiki/Colors_of_noise).

Phase PSD Frequency PSD ADEV
1/f^4, "Black?" 1/f^2, Brownian, random walk sqrt(tau)
1/f^3 ?, "Black?" 1/f Pink constant
1/f^2, Brownian, random walk f^0, White 1/sqrt(tau)
f^0, White f^2 Violet 1/tau

Phase PSD is frequency dependence of the the power-spectral-density of the phase noise.
Frequency PSD is the frequency dependence of the power-spectral-density of the frequency noise.
ADEV is the tau-dependence of the Allan deviation.

These can get confusing! Please comment below if I made an error!

NTP failure detection

Update: Here's how the graph looks like when NTP traffic is enabled again:
ntp

A computer that doesn't receive NTP traffic for a while will have its system time drift quite a lot.

In the absence of NTP (UDP port 123) traffic, we can try to roughly ask for the current time over HTTP using wget from google with this shell script:

#!/bin/sh
/usr/bin/wget --no-cache -S -O /dev/null google.com 2&gt;&amp;1 | \
    /bin/sed -n -e '/ *Date: */ {' -e s///p -e q -e '}'

This outputs a string such as "Sat, 23 Nov 2013 09:14:45 GMT"

Now we can put together a python script that calls this shell script, converts the text-format time-stamp into UTC seconds, and compares against the system time. For plotting we then store the time-error in an RRDTool database. This script is called once per minute using cron.

import subprocess 
import time
import datetime
import rrdtool
import syslog
 
args = ['googletime.sh']
datetimestring = subprocess.check_output(args)
syslog.syslog( "googletime {0}".format(datetimestring))
 
# input: Sat, 23 Nov 2013 09:18:02 GMT
# output: 1385191082.0  (seconds since 1.1.1970)
timestamp = time.mktime( time.strptime(datetimestring, '%a, %d %b %Y %H:%M:%S GMT\n'))
 
# system time, e.g.: 1385191082.0
stime = time.mktime( time.gmtime() )
 
# should be zero, if all is well
terror = stime-timestamp
 
# store the measured error in a database
datastring = 'N:{0}'.format(str(terror)) # 'N:1234'
syslog.syslog( "rrd update: {0}".format(datastring) )
ret = rrdtool.updatev( "time_error.rrd" ,datastring)
syslog.syslog( "rrd updatev: {0}".format(ret) )

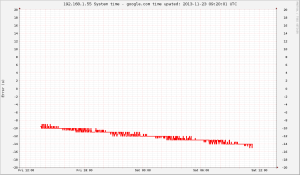
Once we have all the values in our time_error.rrd database we can plot them with rrdtool graph. This is what I get:
system_vs_google_time
There is about -4 seconds of drift during 24 hours, or 46 us/s (46 ppm). If the drift is steady we can guess that the computer was on time 14/4 = ~4 days ago.

The script for creating the rrdtool database is this:

import rrdtool
import time
 
# DS:ds-name:GAUGE | COUNTER | DERIVE | ABSOLUTE:heartbeat:min:max
data_sources=[ 'DS:TERROR:GAUGE:70:U:U']
# RRA:AVERAGE | MIN | MAX | LAST:xff:steps:rows
 
utcsecs = int( time.time() )
pts_day= 24*60
primary = 'RRA:AVERAGE:0.5:1:{0}'.format(pts_day) # 2016 points
rrdtool.create( 'time_error.rrd',           # filename
                 '--start', str(utcsecs),   # when to start
                 '--step', '60',            # step between datapoints
                 data_sources,
                 primary)

And the graph is created by this script. I am using the simple python-rrdtool python bindings - the object-oriented python-pyrrd may have neater syntax and be more pythonic.

import rrdtool
import time
 
graphname = '/var/www/test.png'
day = 24*3600
span = 1*day
starttime = int(time.time()-span)
endtime = int( time.time() + 0.1*span)
updatestamp = time.strftime("%Y-%m-%d %H:%M:%S UTC", time.gmtime(time.time()))
graphtitle = '192.168.1.55 System time - google.com time upated: '+updatestamp
rrdtool.graph(  graphname,
               '--start', str(starttime),
               '--end',str(endtime),
               '--title',graphtitle,
               '--width',str(1024),
               '--height',str(600),
               '--full-size-mode',
               '--upper-limit',str(20),
               '--lower-limit',str(-20),
               '--vertical-label','Error (s)', 
               '--right-axis', '1:0',
               'DEF:terror=time_error.rrd:TERROR:AVERAGE',
               'LINE2:terror#FF0000')

GPIB on Linux

Update 2015 June: additions for Ubuntu 14.04LTS (where a symbolic link is required), and for the NI-USB-B dongle (which needs firmware loading). See also: Using the National Instruments GPIB-USB-B on linux

Notes on how to use GPIB from python on Ubuntu 12.04LTS. Tested with National Instruments USB-GPIB device and a recently bought NI GPIB PCI-E card.

  • Get linux-gpib source from http://sourceforge.net/projects/linux-gpib/
  • Building the python bindings requires libboost-python (and maybe libboost-python-dev)
  • build linux-gpib by running: ./configure, make, sudo make install
  • edit /etc/gpib.conf to fit your hardware. The default config board_type = "ni_pci" seems to work with the NI PCI-E card. For the USB-GPIB device we need board_type = "ni_usb_b"
  • load the kernel module, for the PCI-E card this is sudo modprobe tnt4882, for the USB-dongle this is sudo modprobe ni_usb_gpib
  • On Ubuntu 14.04LTS the library that gpib_config is linked against is installed in a location where the binary doesn't find it. The fix is to add a symbolic link in /lib/
    /lib$ sudo ln -s /usr/local/lib/libgpib.so.0 libgpib.so.0
  • configure: sudo gpib_config --minor 0 this reads and parses /etc/gpib.conf so it needs to be re-done if something is changed in gpib.conf
  • If gpib_config fails, and you have the older/slower NI-USB-B dongle, then you need to first load the firmware. This seems to not be required with the newer NI-USB-HS (to be confirmed?). Firmware loading requires fxload and the firmware from http://linux-gpib.sourceforge.net/firmware/. Find out where your USB-dongle is with lsusb and then load the firmware with something like:
    fxload -D /proc/bus/usb/001/002 -I niusbb_firmware.hex -s niusbb_loader.hex where you replace /001/002 with the numbers for your USB device. Now gpib_config should work.
  • By default only members of the gpib-group can use gpib, and only root has access to /etc/gpib0. If we want normal users to use gpib, add them to the gpib group (on Ubuntu the graphical user&group editor is gnome-system-tools)
  • Test!
    note: If "import gpib" fails in python you might have forgotten to install libboost-python before building linux-gpib. Python bindings will not be built&installed unless you have libboost-python.

I have two devices, so I've configured them like this in gpib.conf

/* agilent mux/dmm */
device {
	minor = 0 /* first gpib-card/usb-dongle */
	name = "dmm"
	pad = 8 /* primary address, configure on instrument front-panel*/
	sad = 0 /* secondary address, always zero? */
}
/* kikusui psu controller */
device {
        minor = 0
        name = "kikusui"
        pad = 1
        sad = 0
}

And now we can try some python:

1
2
3
4
5
6
7
8
9
10
11
12
13
14
15
16
17
18
19
20
import gpib
import time
dmm= gpib.find("dmm") # define in /etc/gpib.conf
kik= gpib.find("kikusui")
 
def query(handle, command, numbytes=100):
	gpib.write(handle,command)
	time.sleep(0.1)
	response = gpib.read(handle,numbytes)
	return response
 
print query(dmm,"*IDN?")
print query(kik,"*IDN?")
 
gpib.close(dmm)
gpib.close(kik)
 
# output:
# HEWLETT-PACKARD,34970A,0,13-2-2
# KIKUSUI ELECTRONICS CORP.,PIA4830,0,2.20

Jämsä-Jukola statistics

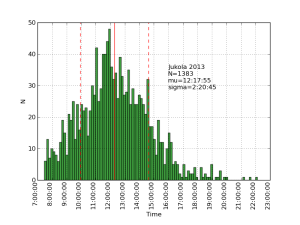
Here's the distribution of total time for teams in the Jämsä-Jukola relay:

Jukola 2013_fig

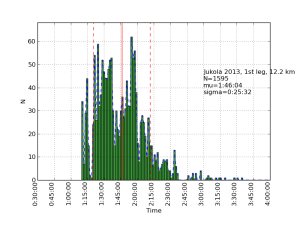
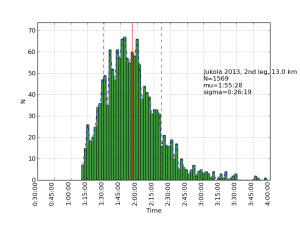
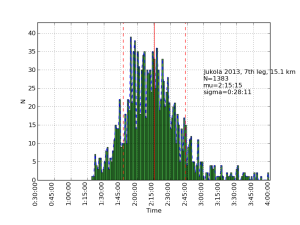
Here are the distributions of individual times for the seven legs of the relay.

Jukola 2013, 1st leg, 12.2 km_fig

The histogram from the first leg shows bunching of runners into groups - this is different from all the remaining legs.

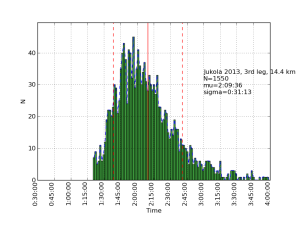
Jukola 2013, 2nd leg, 13.0 km_fig Jukola 2013, 3rd leg, 14.4 km_fig
The 2nd and 3rd leg look quite similar. Note how the histograms lean to the left - there are many amateurs of varying ability which contribute to the long tail to the right.

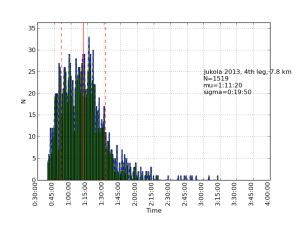
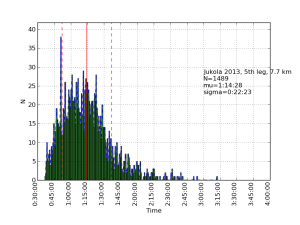
Jukola 2013, 4th leg, 7.8 km_fig Jukola 2013, 5th leg, 7.7 km_fig

The 4th and 5th legs are shorter and faster.

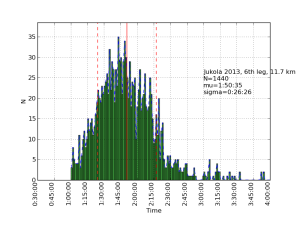
Jukola 2013, 6th leg, 11.7 km_fig Jukola 2013, 7th leg, 15.1 km_fig
The 6th leg is again longer with the final 7th leg being the longest of them all.

Scraping scripts (requires minor modifications to downloaded results html file): jukola_scrape